Ekaterina A. Narodova, PhD; Natalia A. Shnayder, PhD, ScD; Vladislav E. Karnaukhov; Olesya D. Bogomolova; Kirill V. Petrov; Valeriya V. Narodova, PhD, ScD
Abstract
The aim of this study was to assess the dynamics of interhemispheric coherence (IC) as an indicator of integration of different areas of the brain and their participation in the performance of certain functions before and after wrist tapping (WT), using the author’s method in juvenile myoclonic epilepsy (JME).
Methods and Results: The study included 81 subjects of working age, including 51 clinically healthy volunteers (median age of 39[21;56] years) and 30 patients (median age of 27[23;38] years) with JME. Analysis of IC in the electrode pairs Fp1- Fp2, F3-F4, C3-C4, T3-T4 was performed using a computer encephalographic complex. A coherent EEG analysis was used to identify and evaluate the relationships between different areas of the brain. Based on the change in the coherence coefficients (CCs), the level of integrative activity of brain structures was quantified. In healthy volunteers, before and after WT, we observed a statistically significant decrease in CCs for the beta-1 band in the pairs Fp1-Fp2, F3-F4, and C3-C4 (P<0.05), while in the pair T3-T4, changes in CCs were not statistically significant (P>0.05). At the same time, a statistically significant decrease in CCs in the alpha band was found only in the frontal regions in the pairs Fp1-Fp2 and F3-F4 (P<0.05). No statistically significant changes were found in all the studied pairs in the theta band. When comparing CCs in JME patients in beta–1 and theta bands, before and after WT, we did not find statistically significant changes in CCs in all the studied electrode pairs. However, in the alpha band, we found a statistically significant decrease in CCs in the frontal region in the F3-F4 (P=0.0038) and C3-C4 electrode pairs (P=0.034). The results of the study of interhemispheric integration showed statistically significant differences between patients with JME and the control group.
Conclusion: WT according to the author’s method does not provoke the occurrence of interictal epileptiform discharges on the EEG and epileptic seizures in patients with JME. Coherent analysis showed positive changes in interhemispheric integrations of neurons in the beta–1 and alpha frequency ranges, mainly in the anterior hemispheres. (International Journal of Biomedicine. 2021;11(1):73-77.)
Introduction
The pathogenesis of epilepsy is based on the spontaneous membrane instability of neurons, which leads to the appearance of a paroxysmal depolarization shift on the cell membrane. In this case, a sudden prolonged depolarization of the neuron occurs with the resulting flash of discharges. The increased tendency to depolarization of epileptogenic neurons is due to their so-called hypersensitivity caused by damage to the membrane or neuron metabolism: violation of the regulation of the concentration of extracellular ions and (or) transmitters that determine their imbalance. The latter leads to increased excitability of neural networks due to a lack of inhibitory effects.(1) However, an epileptic focus is not yet epilepsy, since in the presence of an electrographically recorded focus, an epileptic attack may be absent, and the disease does not develop. On the other hand, even with clinically manifest epilepsy, epileptic seizures are repeated, as a rule, only with a certain frequency; therefore, in the pauses between them, the epileptic focus remains blocked. In patients with juvenile myoclonic epilepsy (JME), functional disconnections in thalamo-motor and thalamo-frontal networks were found.(2,3) According to the study performed by Y.Wang,(4) functional network activity at rest was shown to be higher in JME patients in several brain regions than in healthy volunteers. At the same time, the brain regions involved in primi hyperfunction are mostly located in the left hemisphere, including the dorsolateral prefrontal cortex, the middle temporal gyrus, and the dorsal part of the striatum. Patients with JME had not only higher average values of indicators over the entire study period, but also a higher level of their variations, as evidenced by standard deviations of time series.
The aim of this study was to assess the dynamics of interhemispheric coherence (IC) as an indicator of integration of different areas of the brain and their participation in the performance of certain functions before and after wrist tapping (WT), using the author’s method in JME.
Materials and Methods
The study included 81 subjects of working age, including 51 clinically healthy volunteers (median age of 39[21;56] years) and 30 patients (median age of 27[23;38] years) with JME. Analysis of IC in the electrode pairs Fp1- Fp2, F3-F4, C3-C4, T3-T4 (Figure 1) was performed using a computer encephalographic complex (“Neurocartograph”, MBS, Moscow).
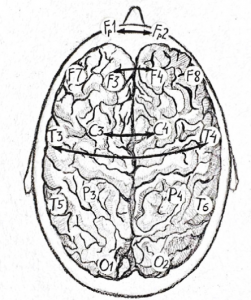
Fig. 1. Pairs of electrodes for evaluating IC: F1 – F2 (frontopolar); F3 – F4 (frontal); C3 – C4 (central); T3 – T4 and T5- T6 (temporal).
We used coherent EEG analysis as an accessible neurophysiological technique that allows us to identify and evaluate the relationships between different areas of the brain, since the coherence coefficients (CCs) allow us to detect and evaluate the functional activity and participation of different areas of the cortex in the performance of certain functions. Based on the change in CCs,(5) it becomes possible to quantify the level of integrative activity of brain structures. At the same time, CC, being a measure of coherent EEG analysis, can vary from 0 to 1: the higher the CC, the more consistent the functional activity and integration of one area of the convexital cortex with another.
The study of the WT was carried out according to the author’s modified methodology, “Method of exogenous rhythmic stimulation influence on an individual human rhythm” [RF patent No2606489 of 10.01.2017].
Inclusion criteria for the main group:
-Patients with JME
-Signed voluntary informed consent
-Male and female
-The age period: the youth (males 17-21; females 16-20 years); the first period of middle age (males 22-35 years; females 21-35 years); the second period of middle age (males 36-60 years; females 36-55 years)
-Russian-speaking Europeans
Inclusion criteria in the control group:
-Healthy adults
-Signed voluntary informed consent
-Male and female
-The age period: the youth (males 17-21; females 16-20 years); the first period of middle age (males 22-35 years; females 21-35 years); the second period of middle age (males 36-60 years; females 36-55 years)
-Russian-speaking Europeans
Exclusion criteria:
— Children and adolescents
— Refusal to participate in this study
— Participation in other studies
-Acute and chronic neurological, psychiatric and
endocrinological disorders at the time of examination
— Alcohol intake (2 or more drinks during the last 2 weeks)
— Use of narcotic drugs at the time of the study and in history
Statistical processing was carried out using the STATISTICA Version 10 (StatSoft, USA). The normality of distribution of continuous variables was tested by Shapiro- Wilk test. Median (Me), interquartile range (IQR; 25th to 75th percentiles) were calculated. The Mann-Whitney U-Test was used to compare differences between two independent groups. The Wilcoxon test was used to compare differences between two dependent groups. A value of P
Results and Discussion
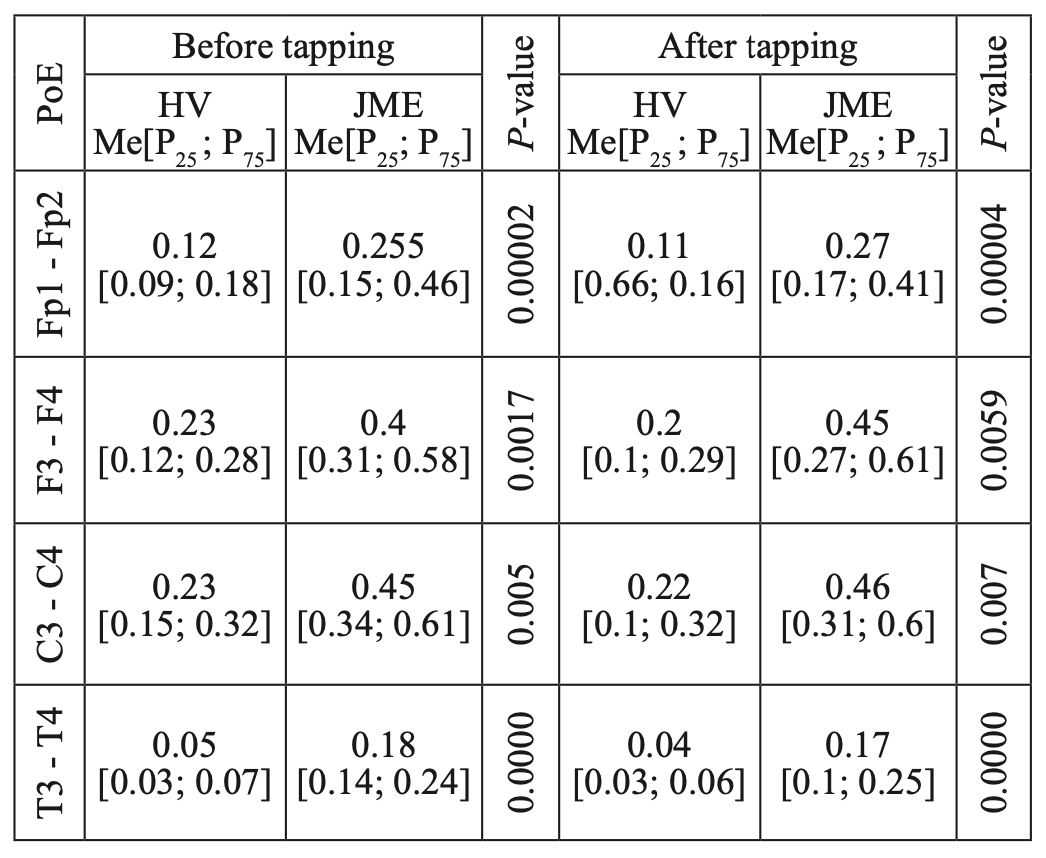
When studying the characteristics of IC in healthy volunteers before and after WT, we found a statistically significant decrease in CCs, mainly in the fronto-central parts of the brain. The decrease was most pronounced for high- frequency rhythms, compared to low-frequency rhythms. A comparative characteristic of IC in the beta-1 band (Table 1, Figure 2) indicates a statistically significant decrease in CC in the antero-posterior direction with a predominance decrease in the fronto-central leads. In particular, we observed a statistically significant decrease in CCs in the pairs Fp1-Fp2, F3-F4, and C3-C4 (P<0.05), while in the pair T3-T4, changes in CCs were not statistically significant (P>0.05).
Table 1.
Comparative characteristics of IC in healthy volunteers in the beta-1 band
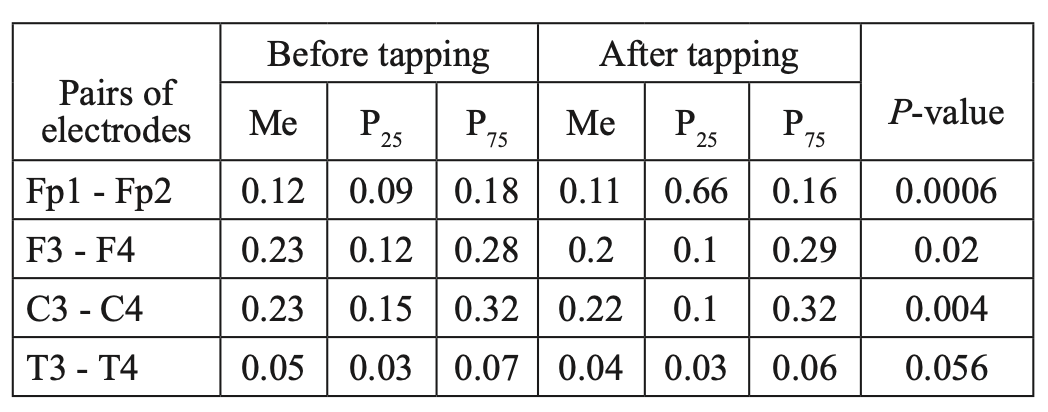
Fig. 2. Main characteristics of IC in healthy volunteers in the beta-1 band: blue column – before WT; orange column – after WT.
Similar dynamics were observed when comparing the characteristics of IC in the alpha band (Table 2, Figure 3). However, the zonal gradient was less pronounced when we analyzed dynamics in the alpha rhythm, compared to the beta-1 band. At the same time, a statistically significant decrease in CCs in the alpha band was found only in the frontal regions in the pairs Fp1-Fp2 and F3-F4 (P<0.05), while changes in CCs were not statistically significant in the pairs C3-C4 and T3-T4 (P>0.05).
Table 2.
Comparative characteristics of IC in healthy volunteers in the alpha band
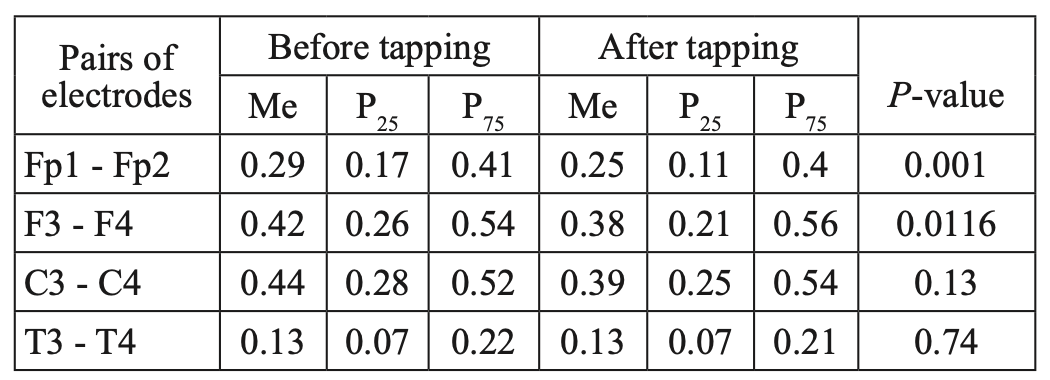
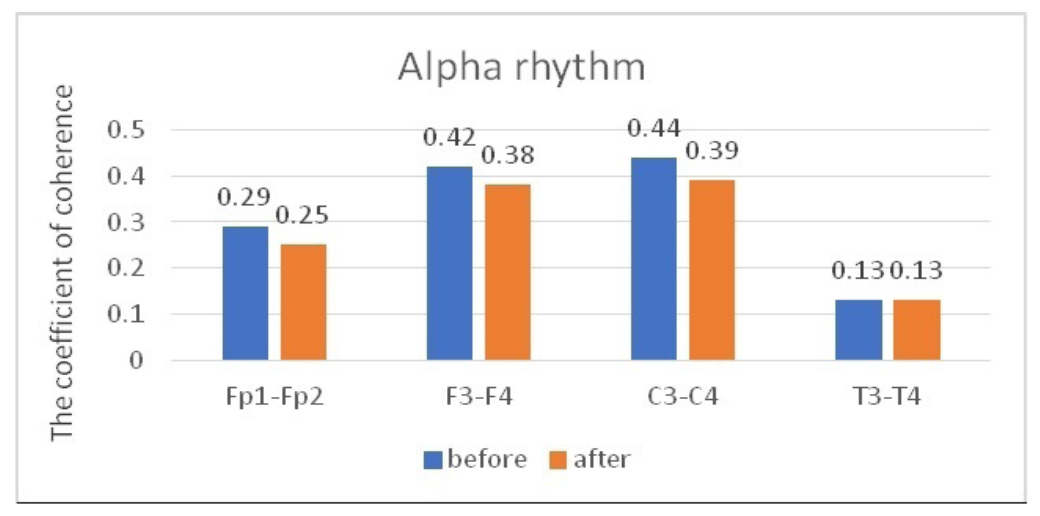
Fig. 3. Main characteristics of IC in healthy volunteers in the alpha band: blue column – before WT; orange column – after WT.
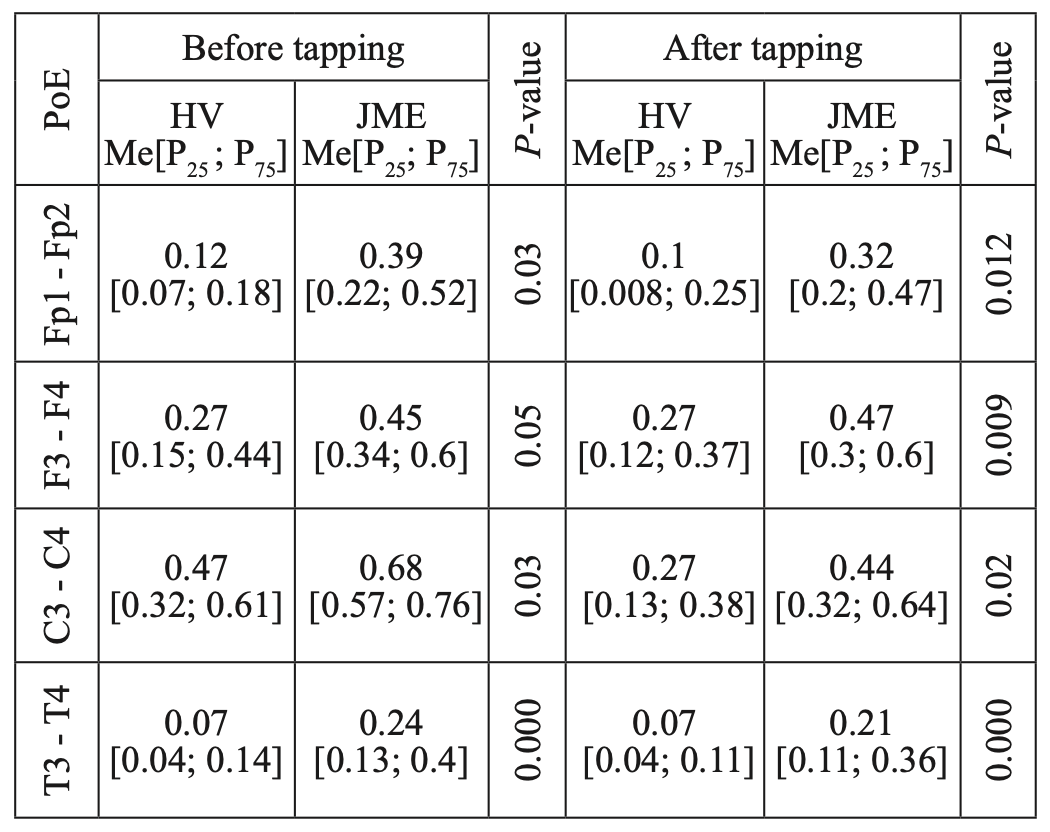
When we analyzed the dynamics of CCs in the theta band, no statistically significant changes were found in all the studied pairs (Table 3, Figure 4).
Table 3.
Comparative characteristics of IC in healthy volunteers in the theta band
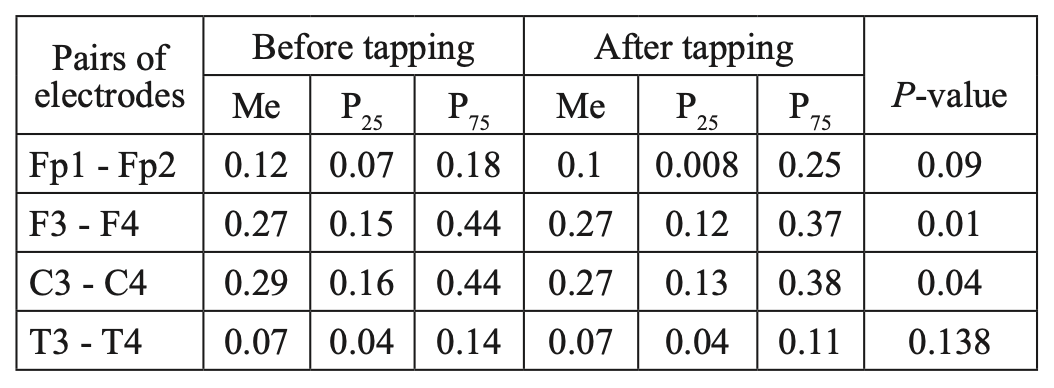
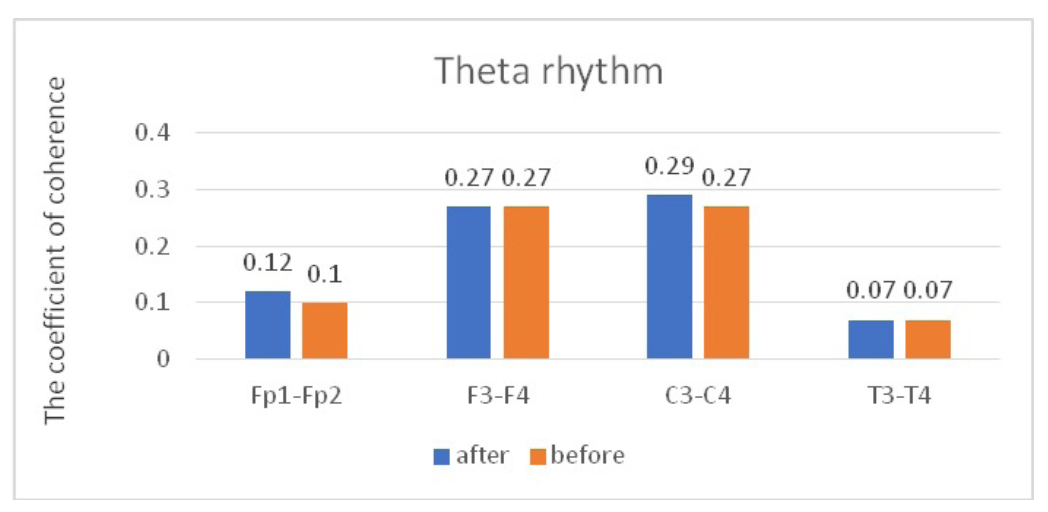
Fig. 4. Main characteristics of IC in healthy volunteers in the theta band: blue column – before WT; orange column – after WT.
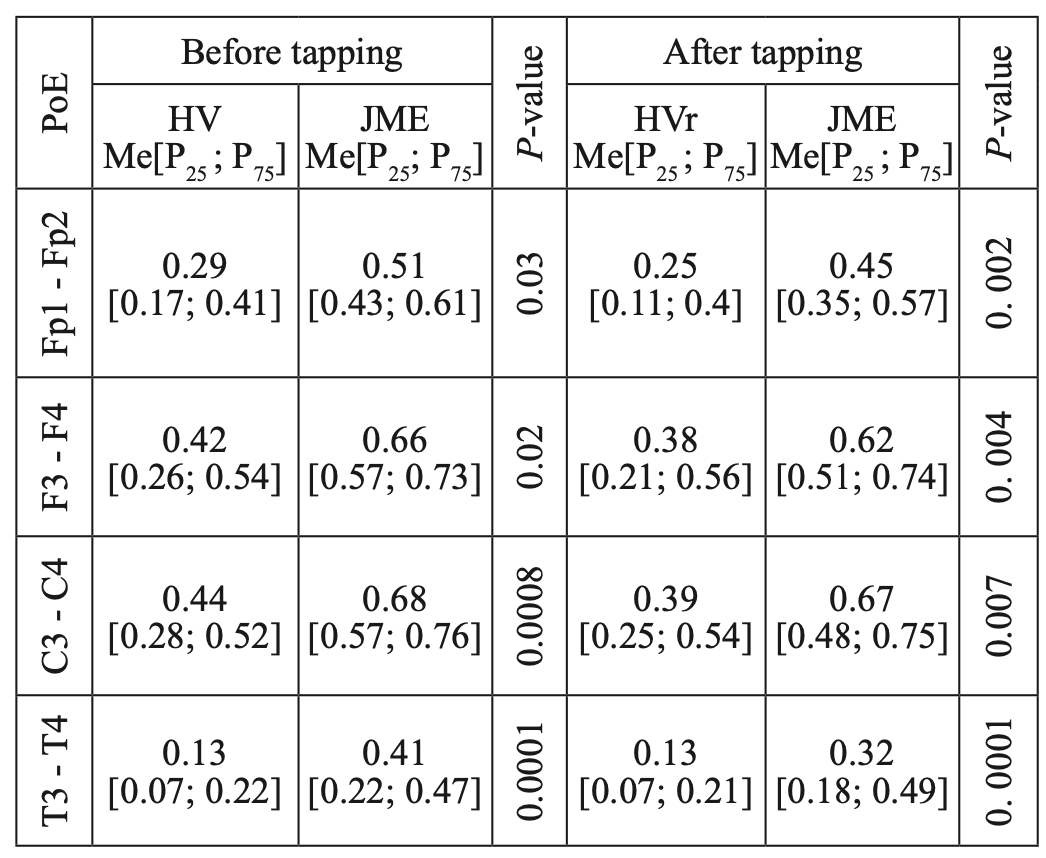
When comparing CCs in JME patients in beta–1 and theta bands, before and after WT, we did not find statistically significant changes in CCs in all the studied electrode pairs (Tables 4, 5; Figures 5, 6). However, in the alpha band, we found a statistically significant decrease in CCs in the frontal region in the F3-F4 (P=0.0038) and C3-C4 electrode pairs (P=0.034) (Table 6, Figure 7).
Table 4.
Comparative characteristics of IC in JME patients in the beta-1 band
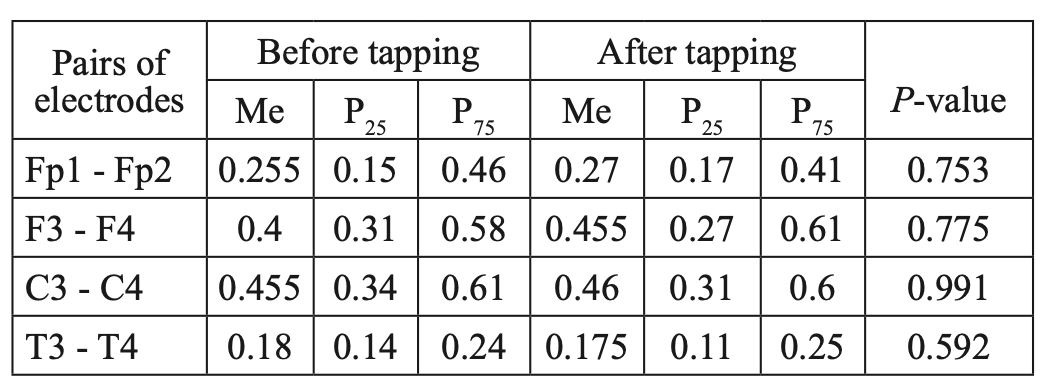
Table 5.
Comparative characteristics of IC in JME patients in the theta band
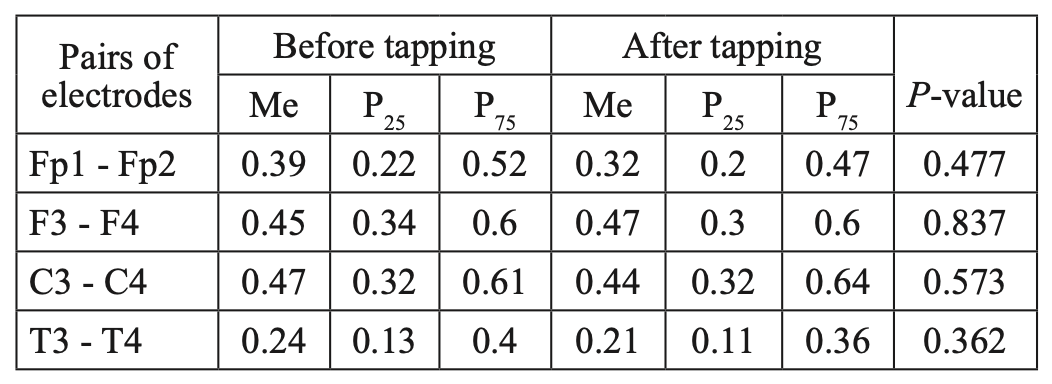
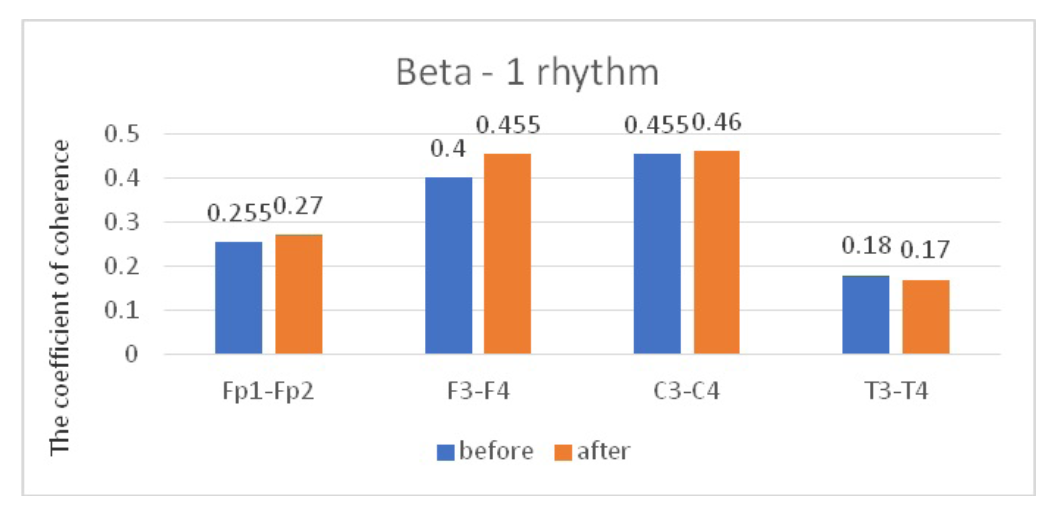
Fig. 5. Main characteristics of IC in JME patients in the beta-1 band: blue column – before WT; orange column – after WT.
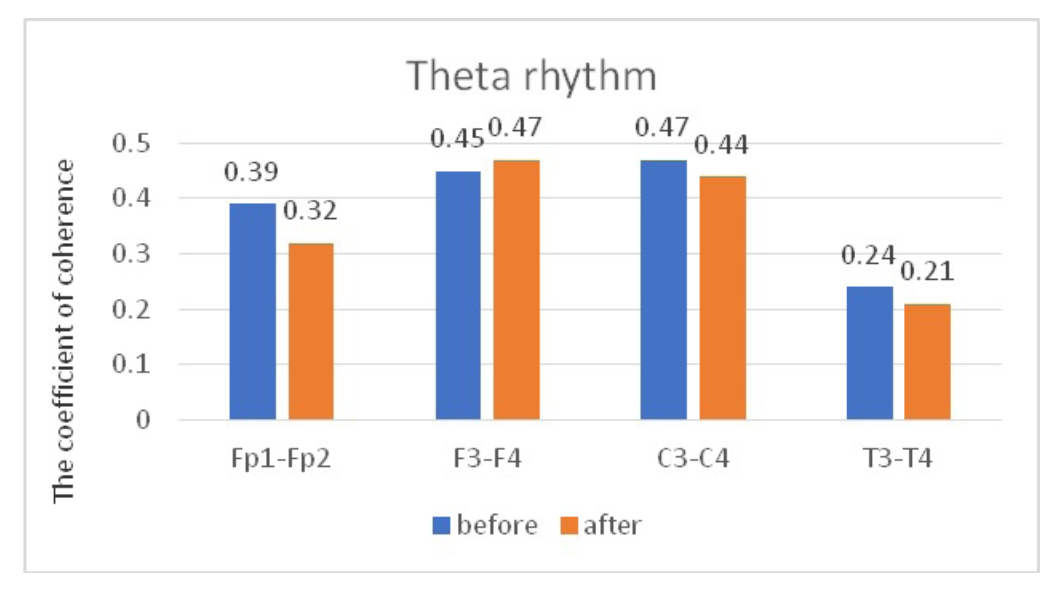
Fig. 6. Main characteristics of IC in JME patients in the theta band: blue column – before WT; orange column – after WT.
Table 6.
Comparative characteristics of IC in JME patients in the alpha band
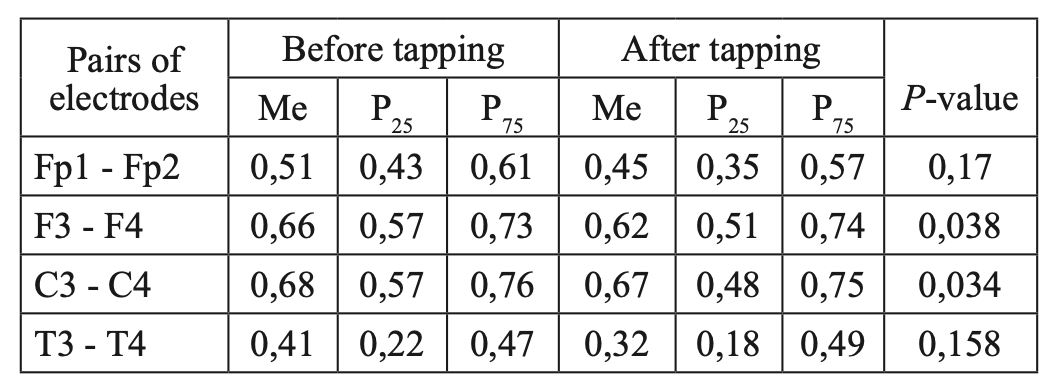
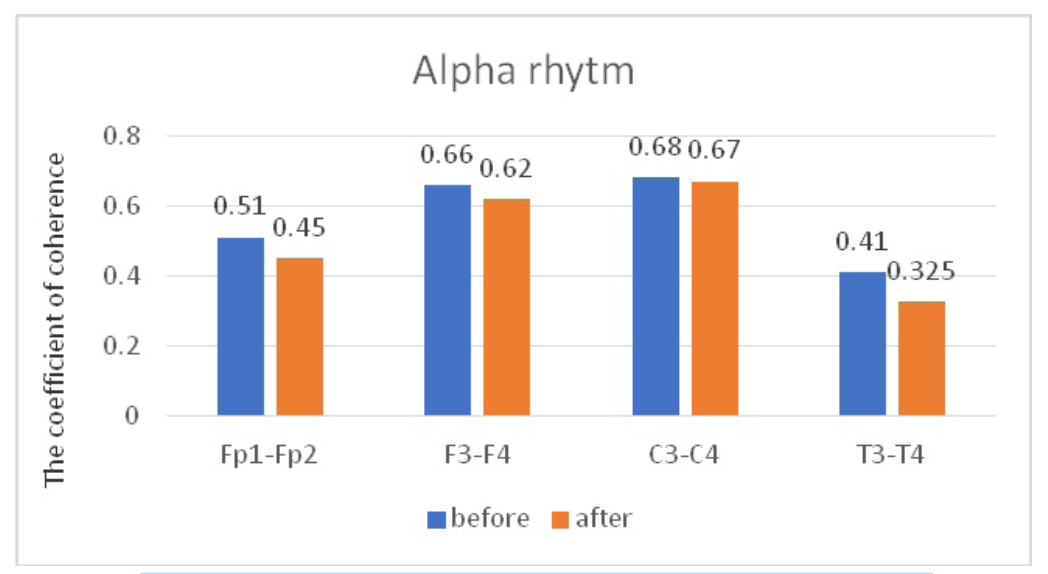
Fig. 7. Main characteristics of IC in JME patients in the alpha band: blue column – before WT; orange column – after WT.
The data we obtained are consistent with the results of studies conducted earlier on healthy volunteers,(6,7) as well as with the results of our studies in the control group of healthy volunteers. After a session of WT according to the author’s method, our control group showed a decrease in the strength of correlations between the coefficients of IC, mainly for the beta–1 band and to a lesser extent for the alpha band, in the anterior hemispheres (frontal cortex). In contrast, a comparable group of patients with JME in the interictal period experienced a statistically significant decrease in the strength of correlations between CCs, to a greater extent for the alpha band, as well as in the anterior hemispheres.
However, a comparative analysis of CCs for the beta– 1 band in JME patients and in the control group showed statistically significant differences in CCs in all studied electrode pairs(Fp1-Fp2, F3-F4, C3-C4, T3-T4), consisting in higher CC indicators, both before tapping and after tapping in JME patients (Table 7), which may be due to a higher level of synchronization of cortical rhythms in epilepsy than in the norm. It is noteworthy that the greatest statistical significance of intergroup differences was noted in the mid–temporal leads (T3-T4), which is consistent with the results of a neuroradiological study on the involvement of the mediobasal parts of the temporal lobe.
Table 7.
Comparative characteristics of IC in healthy volunteers and JME patients in the beta-1 band
HV — healthy volunteer; PoE-pairs of electrodes
A comparative analysis of the characteristics of IC for alpha rhythm also showed statistically significant differences due to higher values of CCs before and after WT in JME patients, compared to the control group (Table 8), while CCs in both the alpha band and the beta–1 band have the most significant intergroup differences in the mid–temporal divisions (T3-T4). A similar picture was observed when we compared the characteristics of IC in the theta band (Table 9).
Thus, the results of the study of interhemispheric integration (based on the analysis of IC coefficients in patients with JME during the interictal period of background EEG at rest and after a WT session using the author’s method) showed statistically significant differences between patients with JME and the control group. However, the dynamics of CC indicators in the JME group, compared to the control group, after a single session of WT according to the author’s method was insignificant, which is probably due to the presence of a stable pathological condition in patients with epilepsy – the epileptoic system.
Table 8.
Comparative characteristics of IC in healthy volunteers and JME patients in the alpha band
HV — healthy volunteer; PoE-pairs of electrodes
Table 9.
Comparative characteristics of IC in healthy volunteers and JME patients in the theta band
HV — healthy volunteer; PoE-pairs of electrodes
Thus, this result suggests that in order to obtain a stable antiepileptic effect by activating the neurons of the antiepileptic system, it is necessary to develop and implement not a single, but a course application of wrist tapping. The prospects of this approach are generally confirmed by the positive changes in the state of cortical rhythm under the influence of wrist tapping on the characteristics of the beta-1 and alpha rhythms.